
What EU Shoppers Buy and How Dropshipping Sellers Benefit
Seven in ten (70%) recent EU online shoppers bought clothing, shoes or accessories in Eurostat’s 2024 survey. The share ranged from 85% in Cyprus to 58% in Estonia and Latvia. For dropshipping sellers considering fashion, that spread is a reason to research what people buy in the country they plan to serve. Eurostat’s 2026 Digitalisation in Europe report
Fashion led the categories Eurostat reported, but a broad figure can take a seller only so far. It tells you how many people bought something in the category. To decide whether to list a particular product, you still need to see what local stores offer, what a supplier can deliver, and how much each sale leaves after costs.
What people in the EU bought online
Among people aged 16–74 in the EU, 45% bought clothing, shoes or accessories online in the three months before the 2024 survey. Beauty and wellness products reached 20%, and furniture, home accessories or garden products reached 19%. Eurostat’s product category figures
| Selected product category | Share of EU residents aged 16–74 who bought online |
|---|---|
| Clothing, shoes or accessories | 45% |
| Cosmetics, beauty or wellness products | 20% |
| Furniture, home accessories or garden products | 19% |
| Sports equipment excluding sportswear | 16% |
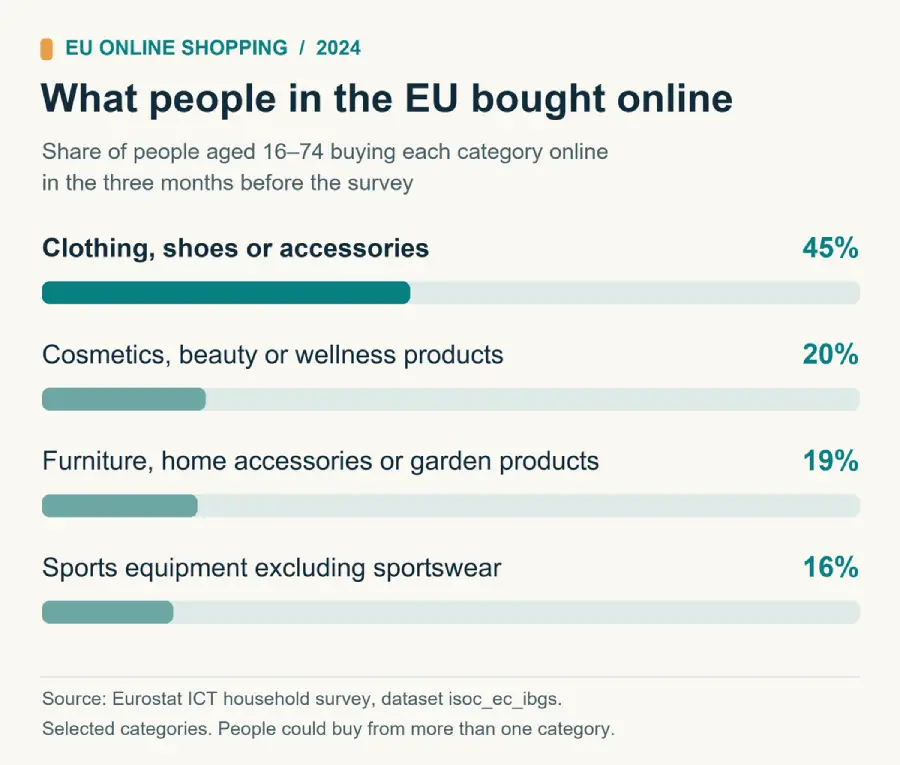
Each percentage counts people who bought something in that category. Someone who bought a pair of shoes and a garden planter appears in both categories. A shopper who bought four pairs of shoes still counts once in the fashion category. The survey therefore measures how widely people bought each type of product. It does not give the share of orders, money spent, or sales fulfilled through dropshipping.
The 45% and 70% fashion figures use the same three-month window but start with different groups. The 45% includes people who made no online purchase. The 70% starts with people who had already bought something online during that period. If you are researching what people buy once they shop online, the second figure is the more relevant one. Eurostat’s comparison among recent online shoppers
Fashion purchases varied across EU countries
Among recent online shoppers, 85% in Cyprus bought clothing, shoes or accessories, followed by 79% in both Bulgaria and Romania. The figure was 60% in Czechia and 58% in both Estonia and Latvia. Cyprus and Latvia were about 27 percentage points apart. Eurostat’s country comparison
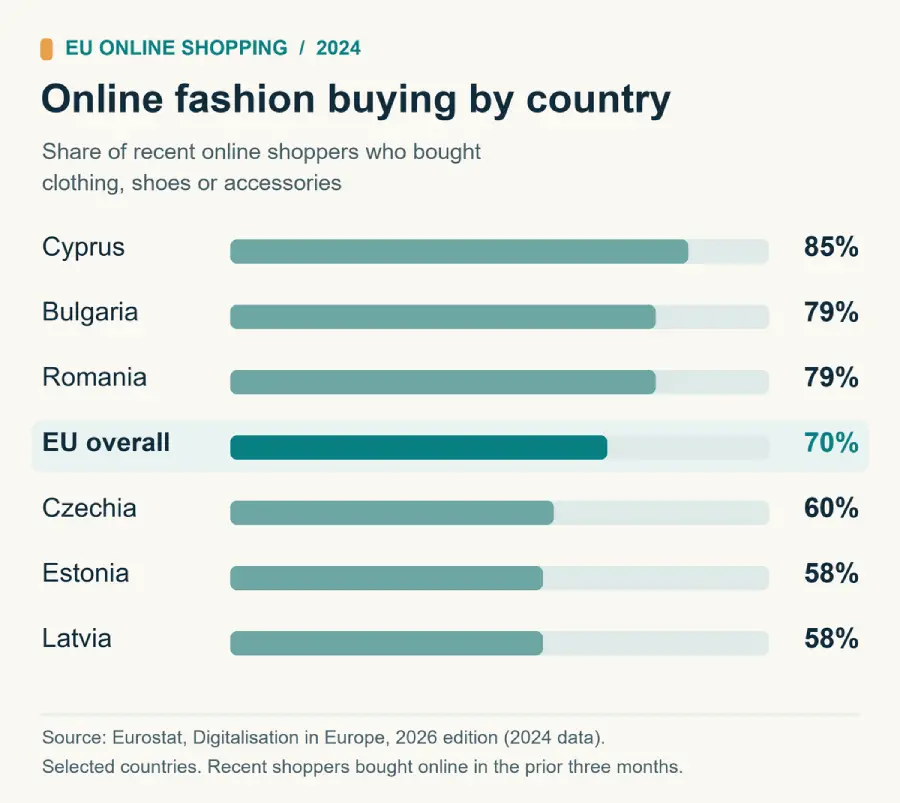
That spread matters if you plan to sell into several EU countries from one storefront. It gives you a reason to research each destination separately. A high percentage can come from a small group of buyers, while a lower percentage in a larger market can represent more people. Before choosing where to launch, consider how many buyers you can reach and what they would pay, including delivery.
Say you want to test a compact travel bag. The fashion figure gives you a reason to look at accessories, but it covers everything from sportswear to shoes. Local listings will tell you more about your product. Search using the terms shoppers in your target country use, compare the total price and delivery window across several stores, and check whether you can offer something those listings leave out, such as clearer dimensions or better photos of the compartments.
Popular categories pose different problems for sellers
Clothing led the survey, but selling a fitted garment can mean stocking several sizes in the supplier’s catalog and dealing with exchanges when the fit is wrong. Before listing it, order a sample and compare its actual measurements with the supplier’s size chart. Find out where an exchange would go and who pays for it. Those details can make two otherwise similar garments very different products to sell.
Home and garden products illustrate a different problem. Eurostat groups furniture, garden products and home accessories together. A compact drawer organizer and a large planter may appear under the same heading, yet the larger item could cost more to ship and to replace if it arrives damaged. Get the packed dimensions and a delivery quote for the destination you intend to serve before comparing prices.
For cosmetics or wellness products, review the supplier’s labeling and product documentation early. If you cannot confirm what arrives in the parcel or verify the claims you would put on your listing, there is little point calculating how much you might make on it.
Turn a category figure into a small product test
Start with one country and two or three products. For each one, record the competitor’s delivered price, your supplier’s dispatch location and estimated delivery time, and the costs you would pay on an order. Order a sample using the shipping method a customer would get. Check the packaging, when tracking becomes available, and whether the item matches its listing.
Then work out what remains from a sale. In a hypothetical example, a €35 order leaves €9 after a €14 supplier charge, €5 for shipping, €1 in payment fees and €6 in advertising. That €9 is before returns, overhead and any applicable taxes. If shipping costs €7 instead, the amount falls to €7. A popular category can still contain products whose costs leave little room to fix a bad order.
Once a test is running, track orders alongside refunds, delivery problems and the amount left after variable costs. Eurostat can help you decide where to start looking. The supplier’s performance and your own sales figures are what tell you whether the product deserves a permanent place in your store.