
What British Online Sales Growth Means for Dropshipping Sellers
Online retail spending in Great Britain was 7.4% higher in July to September 2026 than in the same period a year earlier, according to the Office for National Statistics. However, spending slipped 0.1% compared with the previous quarter. The figures, published on October 23, show a market above its year-earlier level but with little recent momentum. Source: ONS September 2026 retail sales bulletin.
For dropshipping sellers, these statistics provide useful context for the market they compete in. They do not measure dropshipping sales separately, and they cannot establish whether an individual product or store will succeed. Their value lies in showing how online spending is changing—and helping sellers ask better questions about their own results.
Online spending rose over the year but eased more recently
A sales headline can look encouraging or disappointing depending on which periods it compares.
| Comparison | Change in online spending |
|---|---|
| July–September 2026 against July–September 2025 | +7.4% |
| July–September 2026 against April–June 2026 | −0.1% |
| September 2026 against September 2025 | +6.8% |
| September 2026 against August 2026 | −0.4% |
Source: ONS online retail values. Figures are seasonally adjusted.
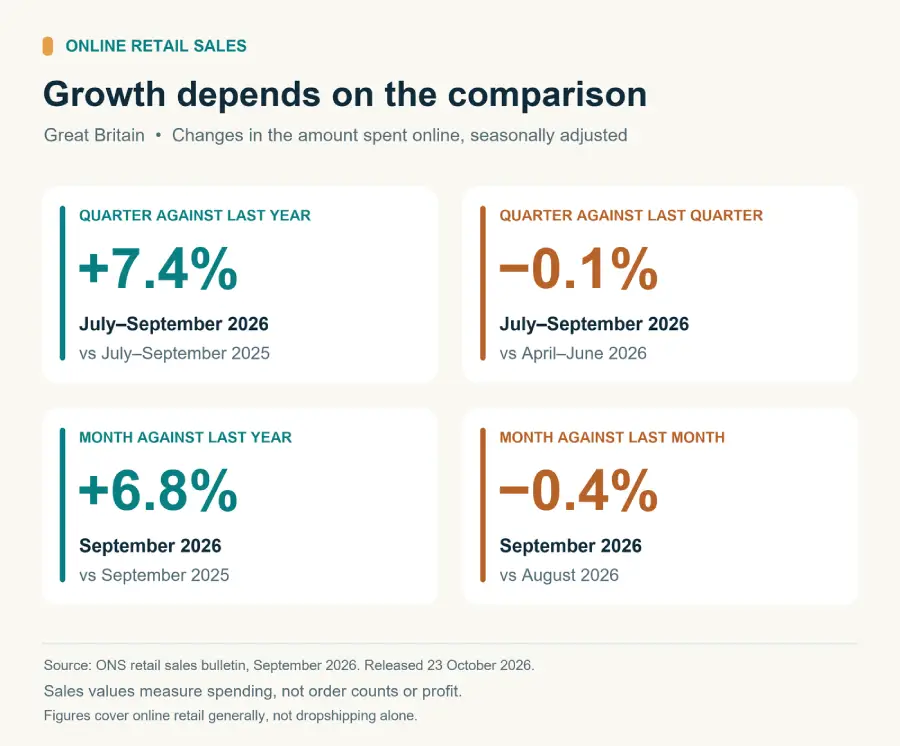
The annual and quarterly comparisons answer different questions. The first shows where spending stands against a year earlier. The second helps identify its more recent direction.
For a seller reviewing a quiet month, that distinction is useful. Compare the same month a year earlier as well as the preceding month. Then check whether your product range, advertising budget or prices changed. A store that doubled its advertising spend is not making a like-for-like comparison simply because it uses the same calendar dates.
Online retail retains a larger share than before the pandemic
The longer-term figures show how much of retail spending has moved online.
| Year | Online share of retail sales |
|---|---|
| 2015 | 12.5% |
| 2019 | 19.2% |
| 2020 | 28.1% |
| 2021 | 30.7% |
| 2022 | 26.6% |
| 2023 | 26.7% |
| 2024 | 27.1% |
| 2025 | 27.5% |
Source: ONS annual internet sales share, series J4MC, as published on October 23, 2026.
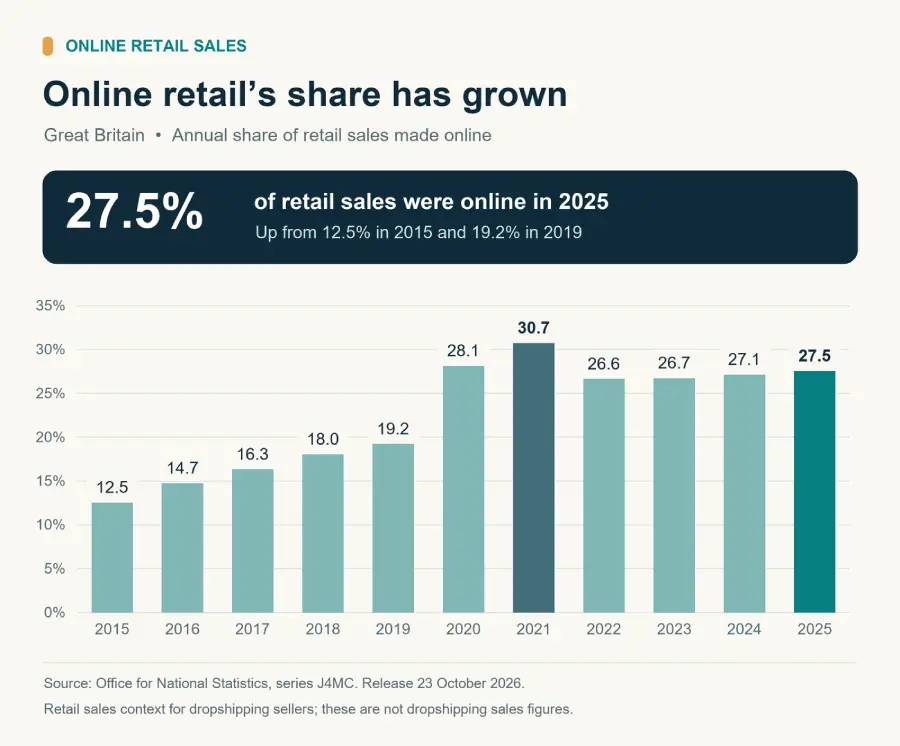
The 2025 share was 8.3 percentage points above 2019, although it remained 3.2 points below 2021. Online retail therefore retained a substantially larger portion of spending than before the pandemic, without maintaining its pandemic-era peak.
These are shares of retail sales, rather than growth rates. A move from 27.1% to 27.5% means online sales accounted for a slightly larger portion of the total. It does not mean online revenue grew by 0.4%.
Nor does the remaining offline share represent sales that a new dropshipping store can automatically capture. Customers may have reasons to buy a particular product in person. The relevant question is whether your offer gives them a reason to buy it from your store.
Clothing shows why the category matters
Clothing offers a more specific example. The ONS series for textile, clothing and footwear retailers puts their online sales share at 28.3% in 2025, compared with 18.5% in 2019 and 33.1% in 2021. Source: ONS textile, clothing and footwear internet sales series.
That pattern resembles the wider shift: online selling remains more prominent than before the pandemic, but below its 2021 share.
The figures describe a retail sector. They are not the percentage of customers buying clothing online, the share of clothing supplied through dropshipping, or a measure of sellers’ profitability.
For someone considering a clothing supplier, the data can help establish context. It cannot select the product range. A general fashion store, a specialist workwear seller and a store selling occasion clothing still need separate research into their customers, prices, competitors and delivery requirements. A national sector average cannot resolve those differences.
Higher sales values do not necessarily mean more orders
The online spending figures measure money spent. The ONS distinguishes sales value from sales volume, which adjusts for price changes. Higher revenue can reflect higher prices as well as changes in the quantity purchased. Source: ONS Retail Sales Index methodology.
A simple hypothetical example shows the difference. A store taking 100 orders at an average value of £40 generates £4,000. If it still takes 100 orders but the average value rises to £43, revenue reaches £4,300—an increase of 7.5%.
The store has more revenue, but the same number of orders. Its profit depends on what happened to supplier prices, shipping charges, advertising costs and other expenses.
A seller reviewing growth should therefore keep order count, average order value and costs alongside revenue. That makes it easier to distinguish stronger demand from a price increase or a shift toward more expensive products.
What the official data covers
The ONS retail survey covers businesses operating in Great Britain, excluding Northern Ireland. It collects information from approximately 5,000 retailers, including large businesses and a sample of smaller ones. Retailers report turnover including VAT, with a separate question about internet sales. Source: ONS survey methodology.
That scope matters when comparing a store’s performance with the published figures. A business selling mainly to American customers has a different market. A seller looking at revenue excluding tax is also using a different accounting basis.
The published series does not identify the fulfillment method behind each sale. It would therefore be misleading to present these figures as the size or growth rate of Britain’s dropshipping industry.
How sellers can use the figures
I recommend using the national data as a starting point for investigation. If your revenue falls while the wider online market grows, examine where the change occurred: fewer visitors, fewer purchases from those visitors, or a lower average order value.
Then look at the products behind the result. One discontinued bestseller or an unavailable supplier item can have a large effect on a small store without saying much about the market overall.
The same approach applies when sales rise. Check whether the increase survives after refunds, advertising and fulfillment costs. Growing revenue is useful, but the amount left from those sales determines whether the business can sustain its offer.
The next decision should come from the combination of market context and store evidence. Use the ONS figures to understand the broader direction, then use your own orders, costs and customer behavior to decide which products deserve further testing.